
The article “Introducing ZM’s Welfare-GDP framework”, authored by Zafar Masud was published in on August 17, 2026 — Discover the new Welfare-GDP framework for Pakistan—how it measures real welfare beyond headline GDP. Read the methodology and findings.
Welfare-GDP framework — Overview
The article was published by Profit by Pakistan Today, a publication focusing on economic commentary in Pakistan. It was released on August 17, 2026, during a time when economic recovery was emphasized following challenging years. The article has a serious and analytical tone, presenting both the theoretical underpinnings and practical implications of the Welfare-GDP framework.
Zafar Masud, the author, plays a crucial role as he is not only the proponent of this new metric but also suggests its necessity for improving the government’s accountability regarding economic policies. His inclusion is significant as it ties a concrete proposal for measuring welfare directly to the overarching narrative of Pakistan’s economy, significantly stressing the disconnect between traditional metrics like GDP and the lived realities of citizens. The broader narrative touches on the reliance on remittances, job creation issues, and the need for a more inclusive economic growth strategy.
Article Summary
In this article, Zafar Masud introduces the Welfare-GDP framework, a new approach to evaluating Pakistan’s economic growth versus the actual welfare of its citizens. The concept attempts to reconcile the disparity between official GDP figures and the purchasing power experienced by households. By focusing on real per-capita income growth and incorporating various parameters such as income distribution and price indices tailored for lower-income households, the framework aims to provide a more accurate picture of economic well-being. Masud stresses the importance of government accountability, proposing that the Welfare-GDP index be used alongside headline growth statistics to ensure that reforms genuinely benefit the populace.
See also: Welfare-GDP Beyond Arithmetic: Building a Competitive Pakistan
Introducing ZM’s Welfare-GDP framework — Article by Zafar Masud
By Zafar Masud. published in on August 17, 2026

Introducing ZM’s Welfare-GDP framework
Pakistan’s macroeconomic numbers are, at last, moving in the right direction — and yet reckoning is not necessarily development.
Every economy keeps two ledgers by default and instinctively. One is kept by the state: it records that output rose 3.7 percent last year, the best figure in four years.
The other is kept, informally, by a hundred million kitchens: it records what a month’s income buys, and by that ledger the movement is not at the same pace as the state’s.
Both books are authentic — they simply count different things. The state’s ledger counts production; the family’s counts purchasing power, per person, at the prices that family faces.
Pakistan has never reconciled the two, in explicit numbers, and the reconciling entry may be the most important line our statistics could carry. I propose we start carrying it, under its own nomenclature: the “Welfare-GDP”.
Having made the broad case for the concept already, what follows here is the next step — the full methodology.
How is the number actually built? What assumptions does it rest on, and how honestly are they declared? Has it been independently verified? And what does it show when we run it not over the short run — one year or so — but over a longer timeline — a quarter of a century?
A word on presentation of numericals before we begin: because parts of the construct are modelled rather than surveyed, every modelled figure in this thesis is reported as a range with a central estimate, never as a false-precision point.
My purpose is to lay out the arithmetic in enough detail that readers can judge it for themselves rather than take my word for it.
The construct fits in a single line: welfare growth equals real per-capita disposable income growth, distribution-weighted, deflated by a poverty-line price index.
Every term in that line is one of four honest adjustments, none of them exotic, each a fact we already know; the only novelty is applying them together and consistently.
The first is population — and here the divisor is itself an interval, not a point. The census counts growth of roughly 2.5 percent a year; international estimates run nearer to 1.6; and the true divisor should in any case be net population growth — births minus deaths minus net migration — because with some three-quarters of a million workers leaving annually, the resident population grows more slowly than the gross count suggests. The method, therefore, carries population as a declared range, and last year’s per-head growth accordingly lies between roughly 1.2 and 2 percent, rather than at any single decimal.
The second adjustment is income versus production. GDP is blind to more than forty billion dollars our overseas workers send home, through official banking channels, each year; replace production with income — gross national disposable income, or GNDI, taken net of outward transfers and factor payments, the same netting discipline applied to every flow — and the base runs some eight to nine percent above GDP. Note the direction: this adjustment flatters the headline, which is evidence that the method is not stacked against it.
The third is distribution, for an average is not a household — a mean can be lifted by gains at the top while the typical family stands still. The measure adopts the World Bank’s shared-prosperity cohort — the growth of mean income of the poorest forty percent, which is also a formal indicator under the Sustainable Development Goals — so that the target population is an internationally defined standard rather than an author’s convenience.
The fourth is the prices the poor actually pay: food and energy claim over half of a poor household’s budget, so the measure deflates each income group by a price index weighted to its own consumption basket rather than the national average.
The architecture is deliberately built in two tiers, and the distinction is the heart of the method’s honesty.
Tier one is the robust floor: the per-capita and national-income corrections, computed entirely from World Bank national accounts, where the only discretion is the choice of population series — carried, as above, as a range.
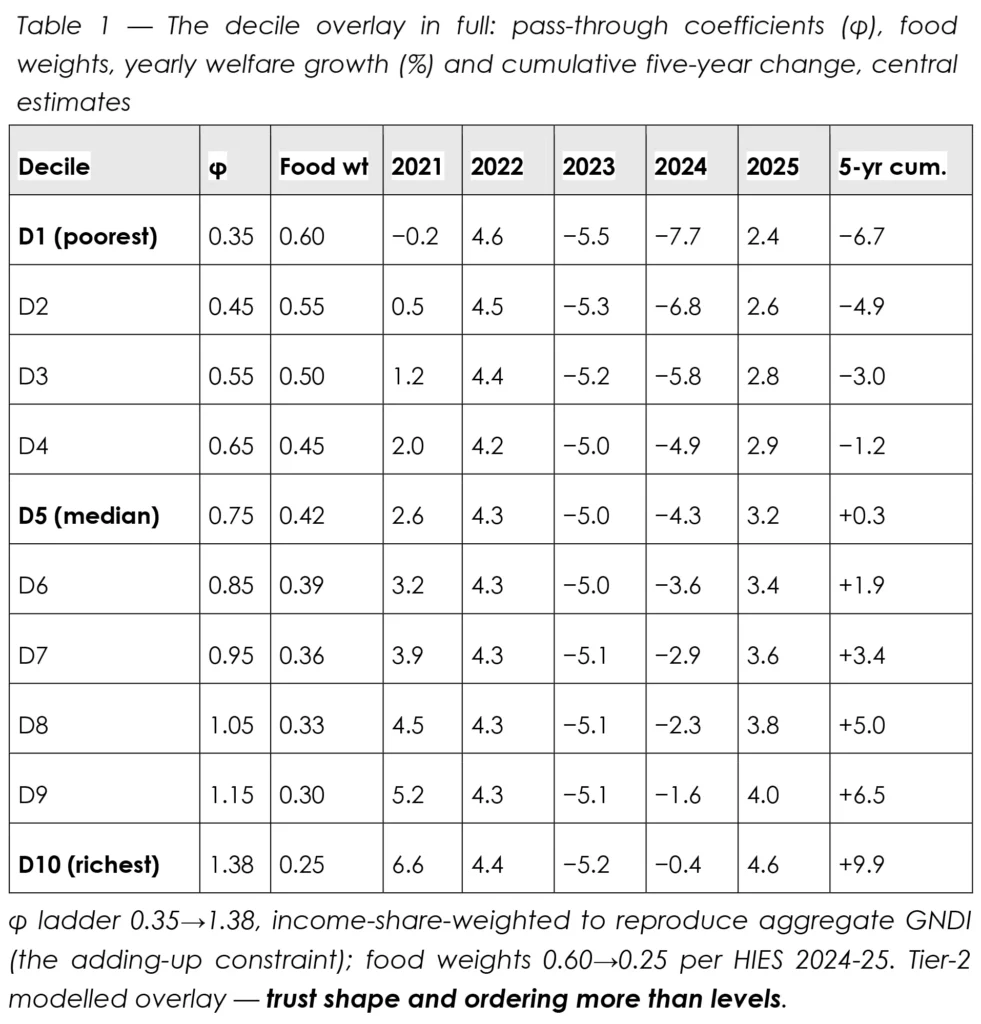
Tier two is the indicative overlay: distribution and poverty-line prices, which must be parameterised because Pakistan does not survey household income annually. The overlay divides the population into ten income groups and assigns each two parameters, both declared in full in Table 1.
The first is a pass-through coefficient, φ — how much of each unit of aggregate income growth reaches that decile — rising from 0.35 for the poorest tenth to 1.38 for the richest. Only one point on that ladder is pinned by accounting identity: the income-share-weighted average of the coefficients must equal one, so that the ten deciles add back up to aggregate GNDI. The slope of the ladder is an assumption, anchored to an employment elasticity of roughly one-half — the empirical observation of how weakly growth translates into jobs and wages at the bottom of our labour market.
The second parameter is the food weight in each decile’s deflator, taken directly from the latest Household Integrated Economic Survey: falling from 0.60 for the poorest decile to 0.25 for the richest, with 0.50 applied to the bottom-forty category as a whole. Neither parameter family is invented; both are anchored, and both are declared. Nor is decile-specific inflation an eccentric idea: as of this year it is official statistics in the United States, whose Bureau of Economic Analysis now publishes an income-stratified price index — external validation that the fourth adjustment is measurable at national-accounts standard.
The remaining assumptions deserve to be stated just as plainly, because a measure proposed in good faith must declare where it is soft.
- First, the parameters are held constant across every window — φ and the food weights are fixed at their latest survey values even when the model is run back twenty-five years, when in reality pass-through and food shares drift over decades.
- Second, population growth is applied uniformly across the window, and the census-versus-international gap — compounded by the question of netting out migration — touches every per-capita figure in the exercise; this is precisely why those figures are presented as bands.
- Third, there is still a timing mismatch in the price data: the headline index is calendar-year while the food index is fiscal-year, which adds noise to any single year’s premium, though it largely cancels across multi-year windows.
- Fourth, and most fundamentally, tier two is a parameterised overlay, not survey data — which yields the method’s standing instruction to every user: trust the ordering and the shape of the results more than any exact level, and read every modelled figure as a range around a central estimate.
The precise numbers, therefore, are not sacrosanct; the concept is cardinal.
It must be appreciated that this is a pioneering construct that may warrant refinement with the mentorship of researchers and economists, and I will be pleased to be challenged and corrected for its further improvement.
Before presentation, the construct was stress-tested the only way that counts: by independent recomputation from the raw World Bank data, blind to the original worksheets. The mechanical series survived exactly — headline and per-capita growth matched to the decimal on a like-for-like population series. The income floor emerged as a range rather than a point — between roughly ten and a half and thirteen percent over the five-year window, with the whole spread traced to the treatment of remittances in a single year: the same story, at a softer level.
The verdict on the poorest forty percent held, expressed as a range: cumulative welfare change of somewhere between minus 8.3 and plus 1.4 percent, with central estimates of minus 3.0 to minus 3.5 — negative at the center under both computations.
Two further checks strengthen confidence. The third decile’s path independently reproduces the bottom-forty aggregate, an internal coherence test the model was never tuned to pass. And when the model is narrowed from the bottom forty percent to the poverty cohort alone, the band tightens to between minus 9.3 and minus 3.1 percent — negative under every parameter combination tried.
A conclusion that survives a hostile recomputation, and holds across its entire declared range, is a conclusion worth publishing.

What, then, does the measure show? Over the last five years, the story inverts as the adjustments accumulate: headline growth of nearly nineteen percent narrows to somewhere between five and ten percent per head, recovers to between ten and a half and thirteen when remittance income is counted, and turns negative at the center — minus 3.0 to minus 3.5, inside a range of minus 8.3 to plus 1.4 — for the poorest forty percent of households. The single inflation year of 2022-23 did the damage: on the central path, it erased around six and a half percent of bottom-forty welfare, more than the four surrounding years of growth restored.
Cut the population into ten income groups, and the anatomy sharpens. On the central estimates in Table 1, the poorest tenth lost nearly seven percent of its welfare over the window while the richest tenth gained ten, and the crossover from cumulative loss to cumulative gain sits almost exactly at the median household — half the country above the line, half below it, all inside the same headline number.
The exact decile levels carry the overlay’s uncertainty; the ordering and the location of the crossover survive every parameter combination tried.

The longer horizons are the most instructive because they acquit no particular government and indict the growth model itself. Run the same decile model backwards, holding the declared parameters and reading direction rather than decimals.
Over ten years, every group ends positive — but the poorest keeps under two points of a roughly twenty-five-point aggregate.
Over fifteen years, the poorest tenth ends approximately where it started, against a gain of more than half at the top.
And over a full quarter-century, the richest tenth roughly doubles its welfare while the poorest gains under two percent in total: a round trip to the year 2000.
Whatever else our growth model has produced across regimes, civilian and otherwise, it has not compounded for the people at the bottom of it.

The structure beneath these findings explains why the gap endures. Only one Pakistani in four earns an income, and each earner carries three dependents.
Fewer than half our adults participate in the labor force, and among women, only one in four.
Against roughly three million young people entering the labor market each year, the economy generates perhaps half as many jobs — and around three-quarters of a million left to work abroad last year alone, continuing the trend of recent years.
Under a third of the population produces for all of it: earnings in Riyadh, spending in Karachi, Kharian and Mandi Bahauddin.

This is also why a decade of stagnant household welfare is so calmly borne — an equilibrium I have come to call managed decline.
Exit substitutes for pressure: the young who leave are drawn precisely from the category the economy failed to absorb, and every remittance-receiving household is a grievance settled privately rather than politically.
Beneath the measured economy, an informal one of perhaps a third of GDP, kinship transfers and world-leading private charity provide the safety net the state does not.
These cushions are a mercy for social peace and a quiet warning to reform, for a system whose failures are privately insured generates little demand to fix them. The danger before Pakistan is, therefore, not upheaval but its opposite: an equilibrium just tolerable enough never to be broken.
Breaking it is a choice — and composition matters more than pace, because forcing the pace under this structure would simply run the risk of reproducing another 2022-23, a culmination of preceding fiscal years, as our balance-of-payments ceiling has repeatedly proven.
The equilibrium worth pursuing is different: growth of five and a half to six percent, export-led and labor-intensive rather than forced past the external ceiling; investment lifted from today’s anaemic thirteen percent of GDP towards eighteen; female participation raised from a quarter towards the global average of a third or more; and the employment elasticity of growth pushed from one-half towards seven-tenths, so that growth feeds wages and not only profits — all of it with inflation held in single digits.
The Welfare-GDP is the instrument that tells us, year by year, whether that transition is actually happening.

The world offers precedents but no template. Bhutan measures “Gross National Happiness”, New Zealand “Budgets for Wellbeing”, and the OECD publishes a “Better Life Index” — yet none of these anchors an IMF-era stabilization to household welfare.
Pakistan can be the first, and the first step costs nothing: publish the welfare-adjusted growth series beside the headline series, periodically, as official statistics — reported, like all honest statistics of this kind, as a central estimate with its band — and let the method be contested, refined and improved in the open, which is how national statistics earn their authority. A statistic, after all, is a promise about what a state will pay attention to.
Once the number exists, it can graduate from report card to compass: growth reported, targeted and managed by the household ledger, so that every budget and every reform is tested against the only question that ultimately matters — did Pakistanis get better off?
Stabilization can be negotiated with creditors; wealth creation can only be willed by a nation. This is where my theory of “Charter of Society” kicks-in, which I have already written about earlier.
Stability is visible; welfare is not — until we choose to measure it — and “Welfare-GDP” is the answer.
The silver-lining is that, while there is a distance still to be covered, the Welfare-GDP index has itself come a long way in the last four years and is moving in the right direction, like the headline GDP — with every income group back in the improvement trajectory in the latest year.
Authored by Zafar Masud. Originally published in on August 17, 2026