
Measuring Welfare-GDP Beyond Arithmetic: Building a Competitive Pakistan From Capital Allocation to Global Competitiveness
The presentation titled “Measuring Welfare-GDP Beyond Arithmetic: Building a Competitive Pakistan From Capital Allocation to Global Competitiveness” delivered by Zafar Masud at the Islamabad Policy Research Institute on August 6, 2026, addresses a persistent disconnect in Pakistani economic policy. While conventional macroeconomic indicators such as headline GDP often signal national growth, median and lower-income households continue to experience stagnation and diminishing purchasing power. This widening gap between top-line statistics and household realities underscores the need for a fundamental recalculation of how national progress is measured and achieved.
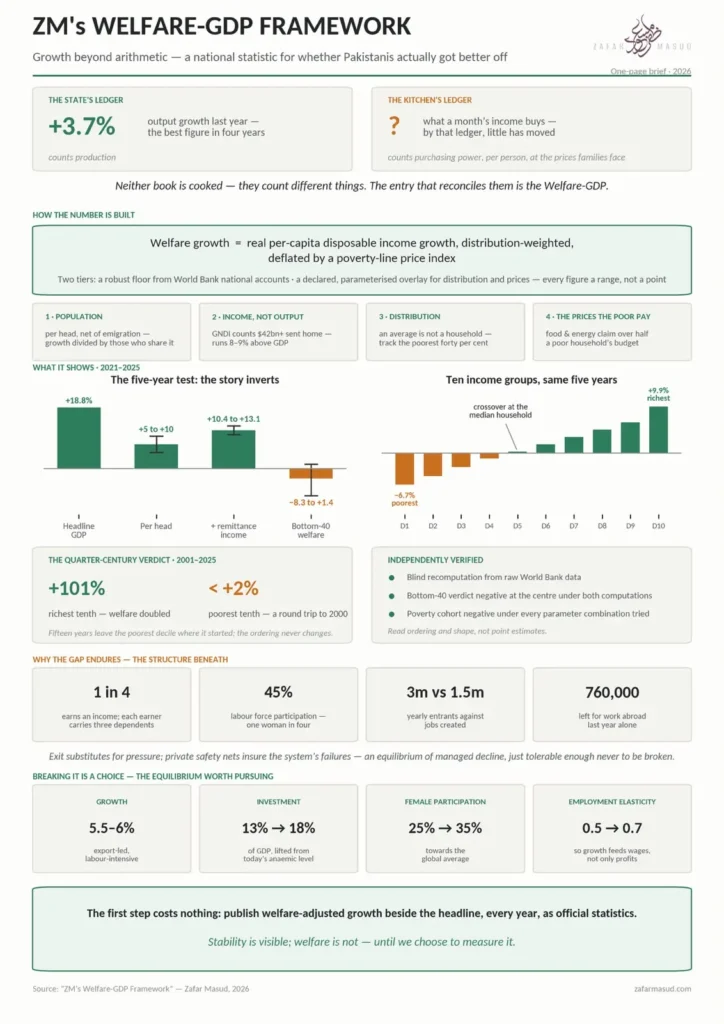
To capture a realistic picture of household economic conditions, Zafar Masud developed a methodology centered on “Welfare-GDP.” This framework modifies official GDP data using four specific adjustments: deducting annual population growth to evaluate real per-capita output, utilizing Gross National Disposable Income to factor in forty-two billion dollars in worker remittances, applying distributional weighting across income deciles to measure inequality, and deflating income using a poverty-line consumer price index heavily weighted toward essential food and energy costs rather than general headline inflation.
The primary purpose of the presentation is to challenge Pakistan’s reliance on short-term macroeconomic stabilization and expose the limitations of the “stabilization trap.” By demonstrating that repeated stabilization cycles through international programs fail to expand underlying productive capacity, the presentation argues for shifting state priorities away from aggregate output metrics toward sustainable, equity-focused wealth creation that directly improves living standards for the lowest income groups.
The data presented illustrates stark disparity over recent financial cycles. Between FY2021 and FY2025, headline GDP grew by a cumulative 18.8 percent, yet the Welfare-GDP of the bottom 40 percent declined by 3.0 percent. Over this same five-year window, the poorest decile suffered a 6.7 percent drop in welfare while the richest decile gained 9.9 percent, with long-term twenty-five-year trends showing a doubling of welfare for the top decile against a negligible 1.7 percent gain for the bottom decile. Furthermore, commercial bank credit remains heavily distorted, with 75 percent tied up in sovereign debt while key sectors like agriculture and small-to-medium enterprises remain severely underfunded.
To remedy these structural distortions, the presentation sets forth clear operational calls to action. The federal government must deploy first-loss credit guarantees to de-risk private bank lending to small businesses and agriculture, transition to accrual-based fiscal accounting to expose off-balance-sheet debt, and focus on fundamental export competitiveness—such as reducing industrial electricity costs and streamlining logistics—rather than relying on currency devaluation. Additionally, labor emigration should be treated as a managed, five-year temporary treasury bridge with a strict sunset clause to stabilize foreign exchange while domestic industrial capacity is restored.
Ultimately, long-term economic resilience requires breaking away from temporary stabilization cycles and establishing institutional continuity. By anchoring policy in a cross-party “Charter of Society” supported by ten-year statutory sunset laws and independent regulatory bodies, Pakistan can establish a predictable business environment, reduce national borrowing costs, and permanently institutionalize Welfare-GDP as the ultimate benchmark of economic success.
Measuring Welfare-GDP Beyond Arithmetic: Re-evaluating Pakistan’s Economic Future
The presentation titled “Measuring Welfare-GDP Beyond Arithmetic: Building a Competitive Pakistan From Capital Allocation to Global Competitiveness” was delivered by Zafar Masud at the Islamabad Policy Research Institute (IPRI) on August 6, 2026. The presentation argues that Pakistan’s conventional macroeconomic metrics—such as headline GDP—mask a severe deterioration in household living standards, particularly among lower-income groups. It outlines a framework to measure actual economic welfare (“Welfare-GDP”), analyzes the “stabilization trap,” and proposes a multi-stage economic plan centered on capital reallocation, export productivity, and institutional continuity.
1. The Core Premise: Headline GDP vs. Welfare-GDP
The presentation highlights a fundamental gap in Pakistani economic policy: headline national accounts reflect growth, while the median household experiences stagnation or decline. To bridge this gap, the author introduces Welfare-GDP, which applies four adjustments to national GDP data:
- Population Growth: Deducts annual population growth (~2.5% per census data). A headline GDP growth of 3.7% translates to only ~1.2% growth per head.
- Income vs. Production (GNDI): Uses Gross National Disposable Income (GNDI) rather than GDP to account for $42 billion in worker remittances, which run 8–9% above GDP.
- Distribution Weighting: Adjusts for unequal wage recovery across income deciles, focusing on the bottom 40% cohort.
- Inflation Disparity (Prices the Poor Pay): Deflates income using a poverty-line CPI weighted heavily toward food (~50–60% budget weight for lower deciles) and energy, rather than general headline inflation.
Macroeconomic Growth vs. Welfare Realities (FY2021 – FY2025)
When these adjustments are applied to Pakistan’s growth trajectory over FY2021–FY2025, headline macroeconomic metrics invert completely. FY2022–23 alone wiped out -6.6% of bottom-40% welfare—more than the combined recovery of the surrounding four years.
| Growth Metric | FY2021–FY2025 Cumulative Change |
| Headline GDP | +18.8% |
| Per Capita GDP (Adjustment 1) | +9.6% |
| Per Capita Real GNDI (Adjustments 1 & 2) | +13.1% |
| Bottom-40% Welfare-GDP (Adjustments 1 through 4) | -3.0% |
Cumulative Welfare Growth by Decile (FY2021 – FY2025)
Over this 5-year window, the poorest decile (D1) suffered a severe welfare decline, while the richest decile (D10) experienced substantial gains. The crossover point from negative to positive growth occurred at the median (D5).
| Decile Cohort | Economic Group | FY21–FY25 Welfare Growth |
| Decile 1 | Poorest 10% | -6.7% |
| Decile 2 | 10% – 20% | -4.9% |
| Decile 3 | 20% – 30% | -3.0% |
| Decile 4 | 30% – 40% | -1.2% |
| Decile 5 | Median (40% – 50%) | +0.3% |
| Decile 6 | 50% – 60% | +1.9% |
| Decile 7 | 60% – 70% | +3.4% |
| Decile 8 | 70% – 80% | +5.0% |
| Decile 9 | 80% – 90% | +6.5% |
| Decile 10 | Richest 10% | +9.9% |
Historical Welfare Accumulation Horizons
Running the decile model over broader timeframes shows a systemic pattern of top-heavy wealth accumulation where lower income groups remain stagnant or experience real income erosion.
| Historical Time Horizon | Overall Aggregate Growth | Bottom Decile (D1) Outcome | Top Decile (D10) Outcome |
| 10-Year Horizon (FY16–FY25) | +24.9% Aggregate | Retained <2% of total gains | +32.2% Growth |
| 15-Year Horizon (FY11–FY25) | Net expansion | -0.2% (Net stagnant) | +50.6% Growth |
| 25-Year Horizon (FY01–FY25) | Long-term growth | +1.7% Total gain | +101.2% (Doubled) |
2. Structural Realities & The Stabilization Trap
Key Demographic and Labor Market Indicators
| Indicator / Metric | Quantitative Reality | Operational & Economic Impact |
| Earning Dependency Ratio | 1 Earner per 3 Dependents | Only 25% of the population actively generates income. |
| Labor Force Participation | 45% Total (Female: ~25%) | Substantial unutilized labor, particularly female labor force. |
| Annual Job Creation Deficit | 3.0M Youth Entries vs. 1.5M Jobs | 50% annual employment shortfall driving emigration. |
| Overseas Labor Migration | 760,000 Workers (Past Year) | High brain drain and overseas worker deployment. |
| Informal Economy Share | ~33%+ of total GDP | Serves as a private safety net alongside remittances & charity. |
Stabilization vs. Wealth Creation
The presentation acknowledges macroeconomic stabilization successes in FY25: a narrowed fiscal deficit (5.4% of GDP), a historic primary surplus (2.4% of GDP), foreign exchange reserves reaching $14.5 billion, single-digit inflation, and sovereign credit rating upgrades.
However, it warns against the “Stabilization Trap”—repeatedly entering IMF programs to manage balance-of-payments crises without expanding underlying productive capacity. Drawing comparisons with Asian peers (China, Vietnam, India, Bangladesh), the presentation notes that lasting poverty reduction requires productivity-enhancing, labor-intensive, and financially inclusive growth.
3. Capital Allocation & Rebuilding Revenue Architecture
Sectoral Credit Disparities and Structural Crowding-Out
Pakistan’s financial system suffers from structural distortions that prevent commercial capital from reaching productive economic sectors.
| Sector / Domain | Economic Weight / Contribution | Credit Allocation & Financing Gap |
| Sovereign Borrowing | 86% of fiscal deficit bank-financed | ~75% of total bank credit tied up in sovereign financing |
| Agriculture Sector | 46.3% Direct/Indirect GDP, 37.4% Labor | <7% of total bank credit (Rs 2.5 Trillion formal gap) |
| Small & Medium Enterprises | ~40% of GDP (5–7 Million Enterprises) | Only ~325,000 firms formally banked (Informal rates: 30–60%) |
| Private Sector Overall | Primary driver of economic output | 13–15% Credit-to-GDP (vs. ~50% India, >100% Vietnam) |
Capital Reallocation via First-Loss Guarantees
Instead of upfront direct cash spending, the federal government can deploy targeted credit-loss guarantees to de-risk private sector lending, allowing commercial banks to expand credit 6x–8x over the guarantee baseline.
| Program / Target Sector | Structure & Policy Mechanism | Target Output & Reach |
| Agriculture (Kissan Card) | De-risking portal using NADRA/PITB digital verification | ~1M loans approved, PKR 400B disbursed, >99% recovery rate |
| SMEs (Asaan Karobar) | Sovereign credit-loss guarantee pool | PKR 50B guarantee pool unlocking PKR 400–500B bank credit |
| Affordable Housing | Mortgage de-risking framework (ACAG) | First-loss risk sharing to address 10M unit housing shortage |
| Education & Health | Pay-for-Success Impact Bonds (PSIB) | Institutional capital unlocked with performance-linked payouts |
Accounting and Tax Reforms
- Accrual-Based Accounting: Transition from cash-based accounting to an accrual fiscal framework to expose off-balance-sheet circular debt (Rs 2.6 trillion), SOE losses (Rs 833B in FY25; Rs 6.6T accumulated), and unfunded pensions.
- Tax Base Expansion: Broaden direct taxation rather than raising rates on existing compliant filers (63% of tax revenue remains indirect and regressive).
- Tariff Rationalization: Lower import duties on intermediate raw materials to eliminate explicit anti-export bias.
4. Export Competitiveness: Productivity, Not Price
The presentation challenges the notion that currency devaluation alone can sustainably drive export growth, emphasizing structural productivity over exchange rate manipulation.
Weighted Drivers of Export Competitiveness
| Competitive Factor | Relative Weight / Significance | Core Policy Focus |
| Energy Cost & Reliability | 22% | Industrial power tariffs and grid stability |
| Productivity, Skills & Tech | 17% | Worker training, automation, and tech integration |
| Logistics & Trade Facilitation | 14% | Port efficiency, freight connectivity, customs processing |
| Tariff Structure & Input Access | 14% | Duty-free access to raw materials and intermediate inputs |
| Real Effective Exchange Rate | 13% | Currency pricing (accounts for only 13% of export success) |
| Product & Market Diversification | 12% | Broadening export baskets beyond basic textiles |
| Policy Consistency & Stability | 8% | Long-term legislative and regulatory predictability |
Structural Import Dependency & Regional Comparisons
Data from the State Bank of Pakistan (SBP) shows low export price elasticity: a 1% nominal exchange rate depreciation increases export demand by only 0.56%. Furthermore, 37% of Pakistan’s total export value is mechanically tied to imported inputs (24% raw materials, 16% capital goods), causing devaluations to spike production costs.
| Country Benchmark | Industrial Electricity Tariff | Annual FDI Inflows | Cumulative FDI Stock (% GDP) | 30-Year Average REER (1994–2020) |
| Pakistan | 13.5 – 15.0 cents/kWh | $2.46 Billion | ~8% | 116 (Overvalued) |
| Vietnam | 7.5 cents/kWh | $25.0+ Billion | >66% | 91 |
| India | 12.1 cents/kWh | High-scale volume | Moderate-High | 83 |
| Bangladesh | 8.7 cents/kWh | Broad manufacturing | Growing | 87 |
5. Strategic Roadmap & Policy Architecture
To break out of recurring crisis cycles, the document outlines a sequenced, three-phase operational model designed to transition the economy from short-term stabilization to sustainable wealth creation.
Three-Phase Operational Transformation Matrix
| Phase | Time Horizon | Strategic Focus | Primary Policy Deliverables |
| Phase 1: Remittance Bridge | Years 1 – 5 | Managed labor export & FX stabilization | High-skilled labor exports; formalize remittance rails (Roshan Digital, Skill Impact Bonds); 5-year hard sunset clause. |
| Phase 2: Economic Transformation | Years 3 – 7 | Capital reallocation & productivity | Deploy federal first-loss credit guarantees; transition to accrual fiscal accounting; lower industrial energy tariffs. |
| Phase 3: Sustainable Growth | Years 5 – 10+ | Institutional continuity & governance | Enact the “Charter of Society”; pass statutory 10-year sunset laws; guarantee regulatory independence (SECP, NEPRA, OGRA, CCP). |
Detailed Phase Execution
Phase 1: The Remittance “Bridge” Plan (Years 1–5)
Treat labor export as a managed treasury operation to stabilize foreign exchange reserves while domestic industrial capacity is rebuilt.
- Skill Alignment: Scale targeted vocational training to match foreign labor demand in high-value sectors.
- Financial Integration: Channel diaspora savings through formal platforms, Skill Impact Bonds, and dedicated allocations in public asset listings.
- Mandatory Sunset Clause: Enforce a strict 5-year taper model to retire overseas labor reliance as domestic job creation expands (mirroring South Korea’s 1964–1984 transition model).
Phase 2: The Economic Transformation Plan
- Objective Shift: Transition state economic metrics from baseline GDP targets to long-term wealth creation and Welfare-GDP.
- Fiscal Transparency: Adopt full accrual accounting across all state ministries to expose uncapitalized liabilities and circular debt.
- Capital Mobilization: Redirect commercial bank liquidity from government debt to agricultural and SME sectors using sovereign first-loss guarantee structures.
- Productivity Upgrades: Reallocate industrial power subsidies toward direct cost reduction, trade logistics, and technological upgrades.
Phase 3: The Sustainable Plan & The Charter of Society
Anchors long-term economic governance in a binding socio-political agreement (Charter of Society). Drawing historical parallels to institutional reforms in the UK (1688), the US (1787), and Sweden (1938), the presentation contends that durable, cross-party economic rules are necessary to lower country risk premiums, reduce national borrowing costs, and establish Welfare-GDP as the permanent metric of economic progress.